
Graphing Linear Inequalities
Questions
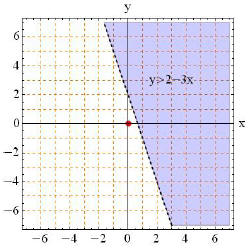
1. Graph the region described by y > 2 − 3x.
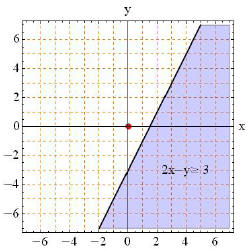
2. Graph the region described by 2x − y ≥ 3.
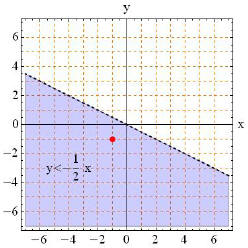
3. Graph the region described by

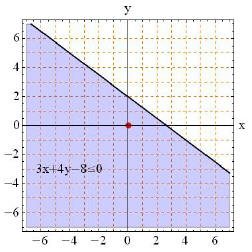
4. Graph the region described by 3x + 4y − 8 ≤ 0.
Solutions
1. First, sketch y = 2−3x, and draw as a dashed line since
we don’t have the equality in the inequality.
You can sketch this using techniques from previous
sections
(slope and y-intercept, or getting two points).
Test Point: (0, 0), colored red in diagram below.
y > 2 − 3x
(0) > 2 − 3(0)
0 > 2 FALSE, so shade side opposite the test point.
2. First, sketch 2x − y = 3, and draw as a solid line
since
we have the equality in the inequality.
Test Point: (0, 0), colored red in diagram below.
x − y ≥ 3
2(0) − (0) ≥ 3
0 > 3 FALSE, so shade side opposite the test point.
3. First, sketch  and draw as a dashed line
since
and draw as a dashed line
since
we do not have the equality in the inequality.
Test Point: (−1,−1), colored red in diagram below.

 TRUE, so shade side with the test point.
4. First, sketch 3x + 4y − 8 = 0, and draw as a solid line
since we have the equality in the inequality.
Test Point: (0, 0), colored red in diagram below.
3x + 4y − 8 ≤ 0
3(0) + 4(0) − 8 ≤ 0
−8 ≤ TRUE, so shade side with the test point.